RS_TD_Library_2Library "RS_TD_Library_2"
TradingView Library for showing option prices on the chart
Here is a simple way to draw options to an underlying asset on the chart. At the top right there is a table with the summary of the corresponding premiums. A tooltip shows the corresponding buy/sell prices for each option.
showTable(sumShortPut, sumLongPut, sumShortCall, sumLongCall, sumTotal, smallLayout)
Shows the table of profit/loss of all options to the given underlying
Parameters:
sumShortPut : Sum of all short put options
sumLongPut : Sum of all long put options
sumShortCall : Sum of all short call options
sumLongCall : Sum of all long call options
sumTotal : Sum of all kind of options
smallLayout : Usage of a small table layout
debugging_labelOnEachBar(_text)
Shows a debugging label on each bar
Parameters:
_text : Text to show on the label
showLine(date1, date2, strike, color)
Prints a line at the strike of the option
Parameters:
date1 : Buying date of the option
date2 : Selling date of the option
strike : Strike of the option
color : Color of the line
showLabel(date, strike, color, tooltip)
Prints a label at the strike of the option
Parameters:
date : Buying/Selling date of the option
strike : Strike of the option
color : Color of the line
tooltip : ToolTip of the option with the detailed prices
Tìm kiếm tập lệnh với "Buy sell"

DB Change Forecast ProDB Change Forecast Pro
What does the indicator do?
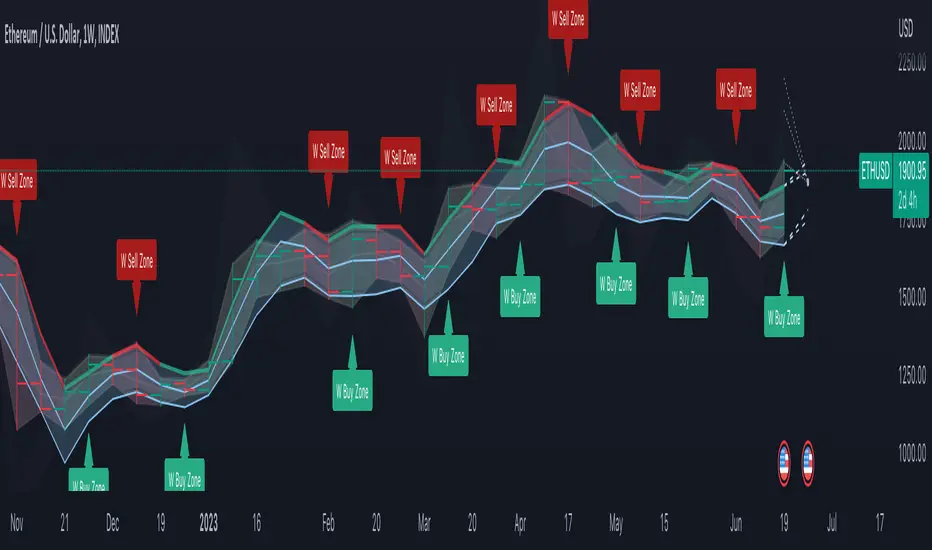
The DB Change Forecast Pro is a unique indicator that uses price change on HLC3 to detect buy and sell periods along with plotting a linear regression price channel with oversold and undersold zones. It also has a linear regression change forecast mode to optionally project market direction.
Change is calculated by taking a two-bar change of HLC3 and dividing that by the price or, optionally, a fixed divisor.
A fast-moving change cloud is then calculated and displayed as the "regular version" plot (shown in light gray). When the cloud bottom is above low, a buy zone is detected. When the cloud top is below the high, a sell zone is detected.
The linear regression price channel is calculated similarly but using a much slower change rate. The linear regression price channel shows reasonable high, low and HLC3 ranges. At the bar's opening, the channel will be more compact and come fairly accurate about 1/4 into the bar timeframe.
The change forecasted price is projected on the right side of the current bar to indicate the current timeframe direction. Please note this forecasting feature is shown in orange when it's early in the timeframe and gray when the timeframe is more likely to produce an accurate direction forecast for the upcoming bar.
You can use these projected dashed lines to see possible market movements for the Current bar and possible market direction for the next bar. Kindly note these projects change; they should be used to understand possible extreme highs/lows for the current bar or market direction.
The indicator includes an optional change forecast projection feature hidden by default. It will project the market forecast channel with an offset of 1. The forecast is defaulted to an offset of 1 to show market direction. However, you can modify to zero the offset to show the current bar forecast and forecast history.
How should this indicator be used?
First, very important,
1. Settings > Set Symbol to Desired
2. Settings > Set High Timeframe to "Chart"
3. Settings > Ensure "Use price as divisor" is checked.
It's recommended to use this indicator in higher timeframes. Buy and sell signals are displayed in real-time. However, waiting until 1/4 to 1/2 into the current bar is recommended before taking action, and change can happen.
The buy/sell signals (zones) provide recommendations on playing a long vs. a short. When in a buy sone, only play longs. When in a sell zone, only play shorts.
Then use the linear regression price channel oversold and undersold zones to optionally open and close positions within the buy/sell zones.
For example, consider opening a long in a buy zone when the linear regression price channel shows undersold. Then consider closing the long when the price moves into the linear regression oversold or higher. Then repeat as long as it's in the buy zone. Then vice versa for sell zones and shorting.
At basic design, buy in the buy zone, sell or short in the sell zone. If you are up for higher trading frequencies, use the linear regression price channel as described in the example above.
Please note, as, with all indicators, you may need to adjust to fit the indicator to your symbol and desired timeframe.
This is only an example of use. Please use this indicator as your own risk and after doing your due diligence.
Does the indicator include any alerts?
Yes,
"DB CFHLC3: Signal BUY" - Is triggered when a buy signal is fired.
"DB CFHLC3: Signal SELL" - Is triggered when a sell signal is fired.
"DB CFHLC3: Zone BUY" - Is triggered when a buy zone is detected.
"DB CFHLC3: Zeon SELL" - Is triggered when a sell zone is detected.
"DB CFHLC3: Oversold SELL" - Is triggered when the price exceeds the oversold level.
"DB CFHLC3: Undersold BUY" - Is triggered when the price goes below the undersold level.
Any other tips?
Once you have configured the indicator for your symbol and chart timeframe. Meaning the plots are displayed over the price. Check out larger timeframes such as W, 2W, 3W, 4W, M, and 4M. It works wonderfully for showing market lows and highs for long-term investing too!
Another, tip is to combine it with your favorite indicator, such as TTM Squeeze or MACD for confirmation purposes. You may be surprised how fast the indicator shows market direction changes on higher timeframes.
You can just as easily use a high timeframe such as D, 2D, or 3D for day trading due to how the linear price channel works.
Why am I not selling this indicator?
I would like to bless the TradingView community, and I enjoy publishing custom indicators.
If you enjoy this indicator, please consider leaving a thumbs up or a comment for others to know about your experience or recommendations.
Enjoy!
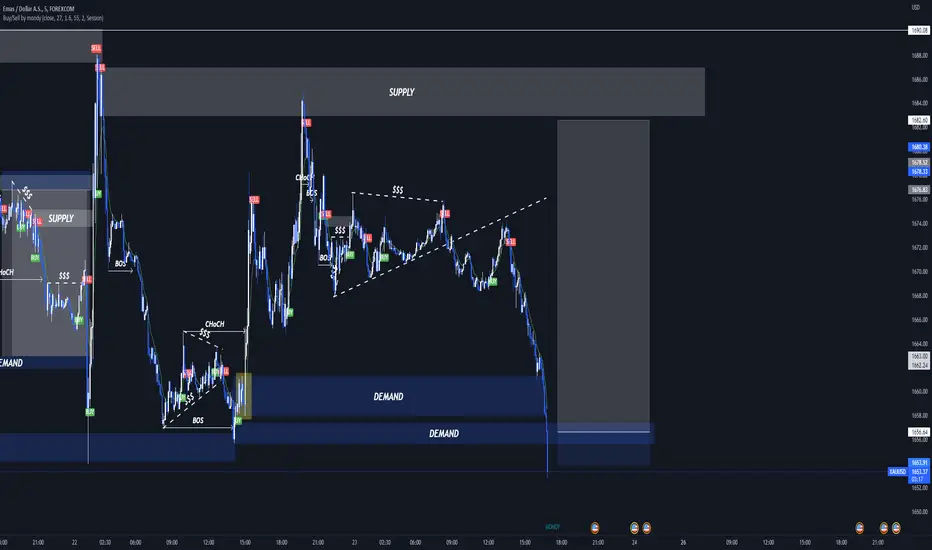
mondy slebewWhat is forex Buy sell?
Hasil gambar untuk buy sell forex
What is buying and selling in forex? Buying and selling in forex is speculating on the upward and downward price movements of a currency pair, with the hopes of making a profit. All forex trading involves buying one currency and selling another, which is why it is quoted in pairs.
Delta Volume Channels [LucF]█ OVERVIEW
This indicator displays on-chart visuals aimed at making the most of delta volume information. It can color bars and display two channels: one for delta volume, another calculated from the price levels of bars where delta volume divergences occur. Markers and alerts can also be configured using key conditions, and filtered in many different ways. The indicator caters to traders who prefer chart visuals over raw values. It will work on historical bars and in real time, using intrabar analysis to calculate delta volume in both conditions.
█ CONCEPTS
Delta Volume
The volume delta concept divides a bar's volume in "up" and "down" volumes. The delta is calculated by subtracting down volume from up volume. Many calculation techniques exist to isolate up and down volume within a bar. The simplest techniques use the polarity of interbar price changes to assign their volume to up or down slots, e.g., On Balance Volume or the Klinger Oscillator . Others such as Chaikin Money Flow use assumptions based on a bar's OHLC values. The most precise calculation method uses tick data and assigns the volume of each tick to the up or down slot depending on whether the transaction occurs at the bid or ask price. While this technique is ideal, it requires huge amounts of data on historical bars, which usually limits the historical depth of charts and the number of symbols for which tick data is available.
This indicator uses intrabar analysis to achieve a compromise between the simplest and most precise methods of calculating volume delta. In the context where historical tick data is not yet available on TradingView, intrabar analysis is the most precise technique to calculate volume delta on historical bars on our charts. TradingView's Volume Profile built-in indicators use it, as do the CVD - Cumulative Volume Delta Candles and CVD - Cumulative Volume Delta (Chart) indicators published from the TradingView account . My Volume Delta Columns Pro indicator also uses intrabar analysis. Other volume delta indicators such as my Realtime 5D Profile use realtime chart updates to achieve more precise volume delta calculations. Indicators of that type cannot be used on historical bars however; they only work in real time.
This is the logic I use to assign intrabar volume to up or down slots:
• If the intrabar's open and close values are different, their relative position is used.
• If the intrabar's open and close values are the same, the difference between the intrabar's close and the previous intrabar's close is used.
• As a last resort, when there is no movement during an intrabar and it closes at the same price as the previous intrabar, the last known polarity is used.
Once all intrabars making up a chart bar have been analyzed and the up or down property of each intrabar's volume determined, the up volumes are added and the down volumes subtracted. The resulting value is volume delta for that chart bar, which can be used as an estimate of the buying/selling pressure on an instrument.
Delta Volume Percent (DV%)
This value is the proportion that delta volume represents of the total intrabar volume in the chart bar. Note that on some symbols/timeframes, the total intrabar volume may differ from the chart's volume for a bar, but that will not affect our calculations since we use the total intrabar volume.
Delta Volume Channel
The DV channel is the space between two moving averages: the reference line and a DV%-weighted version of that reference. The reference line is a moving average of a type, source and length which you select. The DV%-weighted line uses the same settings, but it averages the DV%-weighted price source.
The weight applied to the source of the reference line is calculated from two values, which are multiplied: DV% and the relative size of the bar's volume in relation to previous bars. The effect of this is that DV% values on bars with higher total volume will carry greater weight than those with lesser volume.
The DV channel can be in one of four states, each having its corresponding color:
• Bull (teal): The DV%-weighted line is above the reference line.
• Strong bull (lime): The bull condition is fulfilled and the bar's close is above the reference line and both the reference and the DV%-weighted lines are rising.
• Bear (maroon): The DV%-weighted line is below the reference line.
• Strong bear (pink): The bear condition is fulfilled and the bar's close is below the reference line and both the reference and the DV%-weighted lines are falling.
Divergences
In the context of this indicator, a divergence is any bar where the slope of the reference line does not match that of the DV%-weighted line. No directional bias is assigned to divergences when they occur.
Divergence Channel
The divergence channel is the space between two levels (by default, the bar's low and high ) saved when divergences occur. When price has breached a channel and a new divergence occurs, a new channel is created. Until that new channel is breached, bars where additional divergences occur will expand the channel's levels if the bar's price points are outside the channel.
Prices breaches of the divergence channel will change its state. Divergence channels can be in one of five different states:
• Bull (teal): Price has breached the channel to the upside.
• Strong bull (lime): The bull condition is fulfilled and the DV channel is in the strong bull state.
• Bear (maroon): Price has breached the channel to the downside.
• Strong bear (pink): The bear condition is fulfilled and the DV channel is in the strong bear state.
• Neutral (gray): The channel has not been breached.
█ HOW TO USE THE INDICATOR
Load the indicator on an active chart (see here if you don't know how).
The default configuration displays:
• The DV channel, without the reference or DV%-weighted lines.
• The Divergence channel, without its level lines.
• Bar colors using the state of the DV channel.
The default settings use an Arnaud-Legoux moving average on the close and a length of 20 bars. The DV%-weighted version of it uses a combination of DV% and relative volume to calculate the ultimate weight applied to the reference. The DV%-weighted line is capped to 5 standard deviations of the reference. The lower timeframe used to access intrabars automatically adjusts to the chart's timeframe and achieves optimal balance between the number of intrabars inspected in each chart bar, and the number of chart bars covered by the script's calculations.
The Divergence channel's levels are determined using the high and low of the bars where divergences occur. Breaches of the channel require a bar's low to move above the top of the channel, and the bar's high to move below the channel's bottom.
No markers appear on the chart; if you want to create alerts from this script, you will need first to define the conditions that will trigger the markers, then create the alert, which will trigger on those same conditions.
To learn more about how to use this indicator, you must understand the concepts it uses and the information it displays, which requires reading this description. There are no videos to explain it.
█ FEATURES
The script's inputs are divided in four sections: "DV channel", "Divergence channel", "Other Visuals" and "Marker/Alert Conditions". The first setting is the selection method used to determine the intrabar precision, i.e., how many lower timeframe bars (intrabars) are examined in each chart bar. The more intrabars you analyze, the more precise the calculation of DV% results will be, but the less chart coverage can be covered by the script's calculations.
DV Channel
Here, you control the visibility and colors of the reference line, its weighted version, and the DV channel between them.
You also specify what type of moving average you want to use as a reference line, its source and length. This acts as the DV channel's baseline. The DV%-weighted line is also a moving average of the same type and length as the reference line, except that it will be calculated from the DV%-weighted source used in the reference line. By default, the DV%-weighted line is capped to five standard deviations of the reference line. You can change that value here. This section is also where you can disable the relative volume component of the weight.
Divergence Channel
This is where you control the appearance of the divergence channel and the key price values used in determining the channel's levels and breaching conditions. These choices have an impact on the behavior of the channel. More generous level prices like the default low and high selection will produce more conservative channels, as will the default choice for breach prices.
In this section, you can also enable a mode where an attempt is made to estimate the channel's bias before price breaches the channel. When it is enabled, successive increases/decreases of the channel's top and bottom levels are counted as new divergences occur. When one count is greater than the other, a bull/bear bias is inferred from it.
Other Visuals
You specify here:
• The method used to color chart bars, if you choose to do so.
• The display of a mark appearing above or below bars when a divergence occurs.
• If you want raw values to appear in tooltips when you hover above chart bars. The default setting does not display them, which makes the script faster.
• If you want to display an information box which by default appears in the lower left of the chart.
It shows which lower timeframe is used for intrabars, and the average number of intrabars per chart bar.
Marker/Alert Conditions
Here, you specify the conditions that will trigger up or down markers. The trigger conditions can include a combination of state transitions of the DV and the divergence channels. The triggering conditions can be filtered using a variety of conditions.
Configuring the marker conditions is necessary before creating an alert from this script, as the alert will use the marker conditions to trigger.
Markers only appear on bar closes, so they will not repaint. Keep in mind, when looking at markers on historical bars, that they are positioned on the bar when it closes — NOT when it opens.
Raw values
The raw values calculated by this script can be inspected using a tooltip and the Data Window. The tooltip is visible when you hover over the top of chart bars. It will display on the last 500 bars of the chart, and shows the values of DV, DV%, the combined weight, and the intermediary values used to calculate them.
█ INTERPRETATION
The aim of the DV channel is to provide a visual representation of the buying/selling pressure calculated using delta volume. The simplest characteristic of the channel is its bull/bear state. One can then distinguish between its bull and strong bull states, as transitions from strong bull to bull states will generally happen when buyers are losing steam. While one should not infer a reversal from such transitions, they can be a good place to tighten stops. Only time will tell if a reversal will occur. One or more divergences will often occur before reversals.
The nature of the divergence channel's design makes it particularly adept at identifying consolidation areas if its settings are kept on the conservative side. A gray divergence channel should usually be considered a no-trade zone. More adventurous traders can use the DV channel to orient their trade entries if they accept the risk of trading in a neutral divergence channel, which by definition will not have been breached by price.
If your charts are already busy with other stuff you want to hold on to, you could consider using only the chart bar coloring component of this indicator:
At its simplest, one way to use this indicator would be to look for overlaps of the strong bull/bear colors in both the DV channel and a divergence channel, as these identify points where price is breaching the divergence channel when buy/sell pressure is consistent with the direction of the breach. I have highlighted all those points in the chart below. Not all of them would have produced profitable trades, but nothing is perfect in the markets. Also, keep in mind that the circles identify the visual you would be looking for — not the trade's entry level.
█ LIMITATIONS
• The script will not work on symbols where no volume is available. An error will appear when that is the case.
• Because a maximum of 100K intrabars can be analyzed by a script, a compromise is necessary between the number of intrabars analyzed per chart bar
and chart coverage. The more intrabars you analyze per chart bar, the less coverage you will obtain.
The setting of the "Intrabar precision" field in the "DV channel" section of the script's inputs
is where you control how the lower timeframe is calculated from the chart's timeframe.
█ NOTES
Volume Quality
If you use volume, it's important to understand its nature and quality, as it varies with sectors and instruments. My Volume X-ray indicator is one way you can appraise the quality of an instrument's intraday volume.
For Pine Script™ Coders
• This script uses the new overload of the fill() function which now makes it possible to do vertical gradients in Pine. I use it for both channels displayed by this script.
• I use the new arguments for plot() 's `display` parameter to control where the script plots some of its values,
namely those I only want to appear in the script's status line and in the Data Window.
• I wrote my script using the revised recommendations in the Style Guide from the Pine v5 User Manual.
█ THANKS
To PineCoders . I have used their lower_tf library in this script, to manage the calculation of the LTF and intrabar stats, and their Time library to convert a timeframe in seconds to a printable form for its display in the Information box.
To TradingView's Pine Script™ team. Their innovations and improvements, big and small, constantly expand the boundaries of the language. What this script does would not have been possible just a few months back.
And finally, thanks to all the users of my scripts who take the time to comment on my publications and suggest improvements. I do not reply to all but I do read your comments and do my best to implement your suggestions with the limited time that I have.

Stochastic with DivergencesReuploading as there was an issue with the description.
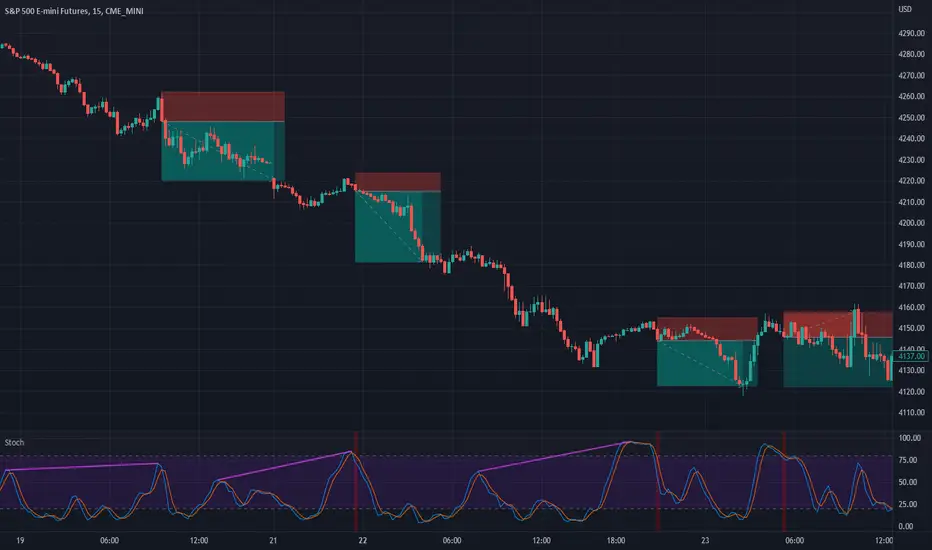
This indicator uses the popular Stochastic indicator as its base. I have included the ability to draw divergences on the indicator as they occur live. By default it will be off, select the settings for the indicator and about halfway down there will be a dropdown menu that says "Off". Select it and then select which divergences you want to draw: Regular, Hidden, or Both. I like to draw both. I find that hidden divergence is really nice during a trending market and the regular divergence is works great in a range market. I also feel that the regular divergence is great during a trending market if you are given the signal but then wait for the next price movement for a double top/bottom to occur. The Stochastic indicator itself is often used in a ranging market by selling when it is overbought and buying once it indicates oversold (much like the RSI indicator). I find that it can work in trending markets if you only take overbought in a down trend and oversold in an up trend. In the above picture you can see that I had used it to trade this downtrend using both the Hidden Divergence and Sell Signals to catch the trend continuation until it failed on the fourth trade. From here I would usually start using the Stochastic as simply an oscillating indicator and buy/sell based on overbought/oversold. I've also added an option to enable the Stochastic RSI if you'd rather use that, as well as a fill option which simply colors in the space between the Stochastic and Signal lines. The Signals option will put on highlights of when to buy or sell based on overbought/oversold areas that agree with the long term trend (based on the 200 EMA).
Divergence is a short way of saying there was a higher or lower movement compared to normal but the price did not represent that movement, indicating strength or weakness in a specific direction.
Regular divergence is an indication of a trend reversal. Regular bullish divergence occurs when the price chart shows a lower low while the stochastic shows a higher low. Regular bearish divergence occurs when the price chart shows a higher high while the stochastic shows a lower high.
Hidden divergence is an indication of a trend continuation. Hidden bullish divergence occurs when the price chart shows a higher low while the stochastic shows a lower low. Hidden bearish divergence occurs when the price chart shows a lower high while the stochastic shows a higher high.
The "Only Trending Divergences" option, if enabled, will only show bearish divergences during a down trend (price is below 200 EMA) and only show bullish divergences during an uptrend (price is above 200 EMA). I like to use this option and have set it to ON by default.
The "Middle Filter" option, if enabled, ensures that Highs on the stochastic indicator will not be counted as Highs unless they are above the middle value of the oscillator (which is 50), same goes for lows: they will not be counted as Lows unless they are below the middle value of the oscillator.
I also include buy/sell signals that coincide with the trend (based on the 200 EMA). If price is currently below the 200 EMA and the stochastic indicator is overbought (over 80), you can get a sell signal when it the blue line crosses down below 80. This sell signal shows that you are in a down trend and the price just was overbought but is now likely to continue pushing downwards. The opposite works for buy signals: Above 200 EMA, stochastic goes below 20, when it crosses above 20 it will show a green highlight to indicate price is likely to push upwards.
I think the default options are likely the best to use. The only one I tend to change on occasion is the "Pivots to look back" which I adjust usually to either 1 or 3.
Simple Buy Sell SignalsIt is a simple indicator that provides buy or sell signals based on the intersection of two EMAs and a simple moving average (SMA). once the Relative Strength Index has confirmed it. For greater accuracy, add additional indicators like stochastic RSI, MACD, etc. Use only for intraday trading, Not for Positional Trading

Simple Buy and Sell SignalsThis is a Simple Indicator which shows buy and sell signals based on MACD and SSL channel.
It is not a Holy Grail Indicator. It shows a lot of false signals when the market is Consolidation Zone.
So don't use this indicator to place trades based on signals given by the indicator.
Use this as a confluence along with your technical analysis
On lower timeframes there are a lot of signals so to eliminate false signals , get a signal on higher timeframe and place a trade in the direction of the trend on lower timeframe.
Hope you'll find this helpful. Enjoy👍.
TriexDev - SuperBuySellTrendMinimal but powerful.
Have been using this for myself, so thought it would be nice to share publicly. Of course no script is correct 100% of the time, but this is one of if not the best in my basic tools.
Two indicators will appear, the default ATR multipliers are already set for what I believe to be perfect for this particular (double indicator) strategy.
If you want to break it yourself (I couldn't find anything that tested more accurately myself), you can do so in the settings.
Basic rundown:
A single Buy/Sell indicator in the dim colour; may be setting a direction change, or just healthy movement.
When the brighter Buy/Sell indicator appears; it often means that a change in direction (uptrend or downtrend) is confirmed.
You can see here, there was a (brighter) green indicator which flipped down then up into a (brighter) red sell indicator which set the downtrend. Once you understand the basics of how it works - it can become a very useful tool in your trading arsenal.
Typically I will use this and other indicators to confirm likeliness of a direction change prior to the brighter/confirmation one appearing - but just going by the 2nd(brighter) indicators, have found it to be surprisingly accurate.
Tends to work well on virtually all timeframes, but personally prefer to use it on 5min,15min,1hr, 4hr, daily, weekly. Will still work for shorter/other timeframes, but may be more accurate on mid ones.

Trend IdentifierTrend Identifier for 1D BTC.USD
It smoothens a closely following moving average into a polynomial like plot.
And assumes 4 stage cycles based on the first and second derivatives.
Green: Bull / Exponential Rise
Yellow: Distribution
Red: Bear / Exponential Drop
Blue: Accumulation
Red --> Blue --> Green: indicates the start of a bull market
Green --> Yellow --> Red: indicates the start of a bear market
Green --> Yellow: Start of a distribution phase, take profits
Red --> Blue: Start of a accumulation phase, DCA

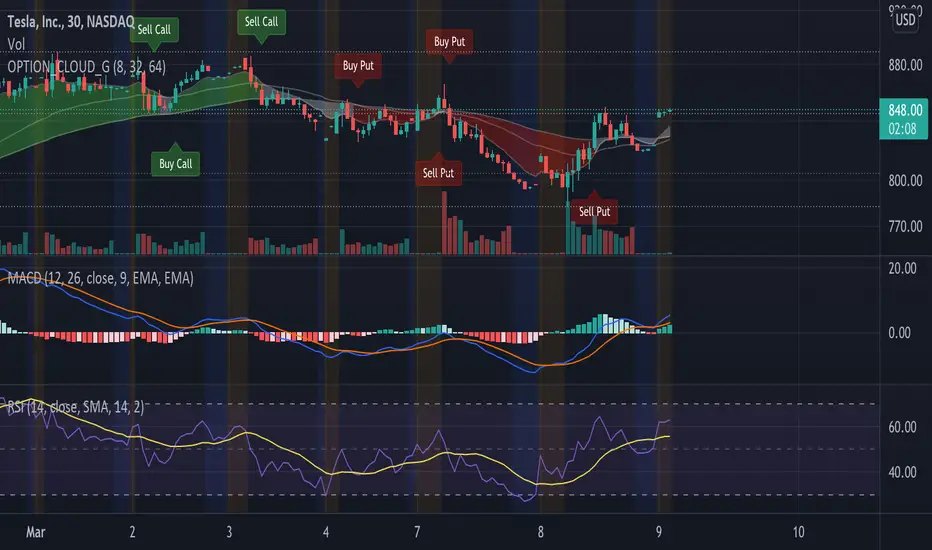
EMA Options Clouds With SignalsEMA Clouds for Options!
This indicator can help you confidently open and close options positions. Note that you should set stop a little below midline EMA . Risk reward for good signals is fairly consistent in profit. Most of the simulations I ran got between 1:2 and 1:4 profits. The losers usually can be avoided by making sure you are not in a choppy trading channel. Wait for EMAs to start separating and don't blindly follow every buy/sell.
3 wave EMA + Clouds:
Defaults:
EMA 8/32/64
Signals (off by default - turn on in settings):
Buy Call/Sell Call (open/exit call positions)
Buy Put/Sell Put (open/exit put positions)
Enter signals bullish:
Close over Middle EMA AND Short EMA > Middle EMA > Long EMA
Exit signals bullish:
Close under Middle EMA OR trend turns bearish (Short EMA < Middle EMA < Long EMA )
Enter signals bearish:
Close under Middle EMA AND Short EMA < Middle EMA < Long EMA
Exit signals bearish:
Close over Middle EMA OR Short EMA > Middle EMA > Long EMA
Cloud Colors (Default)
Green: Bullish
Red: Bearish
White: Chop/Transition
Rate Of Change and rsi zonesHi,
I played with the ROC ( Rate of change ) indicator.
First of all I made it smooth. And came up with decent buy sell signals for long-term potential trades. It can be useful for DCA and profit booking in market tops ( before potential crash)
Recommended time frame = 1 Daily , 3 Daily , Weekly.
Usage :
1. Look for Buy and sell arrow signals. But don't jump straight away. Specially for sell. You might sell early. Instead you can move up your stop loss when you see a sell signal or profit book partially.
if you wait and combine with your own supply and demand zones you can get some nice sell price.
2. Better to wait and look for a divergence in price and ROC. As price will slow down it will reflect on the ROC line. Which means market is exhausted and potentially a correction might happen.
3. You can draw trendline one the ROC and look for breakout. ( warning won't always work )
4. You can also see the RSI in thick red/green color. It will help you determine oversold and overbought zones. Trick is don't sell when it's oversold ( red thick line) . Because it might be a start of a strong uptrend.
So better is to wait and see when the signal is printing then execute.
Best strategy is to DCA and sell in parts whenever you see such signals.
I believe it will visually help us that when to be bull and when to be bear.
Anyway if you find it useful let me know in the comment.
Also if you have some idea to improve the code you can contribute as well.
Thanks . Feedbacks are welcome.

Simple scalping strategy for SOLThis is a simple scalping strategy for trading SOL made on top of the Rebalance Oscillator and the Rebalance Bear/Bull market indicators.
It is intended mostly as proof that these two indicators have their benefits even in simpler strategies.
This strategy in particular works well for the Bear months (check Nov. in the data window) but considerably underperforms Buy&Hold for the Bull months.
It tries to do a market operation per candle whenever the candle happens in a buy/sell trading window of the
Rebalance Bear/Bull indicator ().
It always buys/sells the same amount by default (you can set it in the cog menu in the option "Base Crypto Amount To Trade"),
for SOL this is set to 1.0SOL.
This is my first attempt at scalping, it differs slightly from the standards because it does not require fast
response candles or immediate market operations (it can work well with limit trading) and on top of this it also
does not require a stop loss since it uses an indicator that provides the trading windows (surprises can still happen though).
The profit that this strategy tries to take for each buy/sell pair is not configurable and is set at 12% each way when it happens.

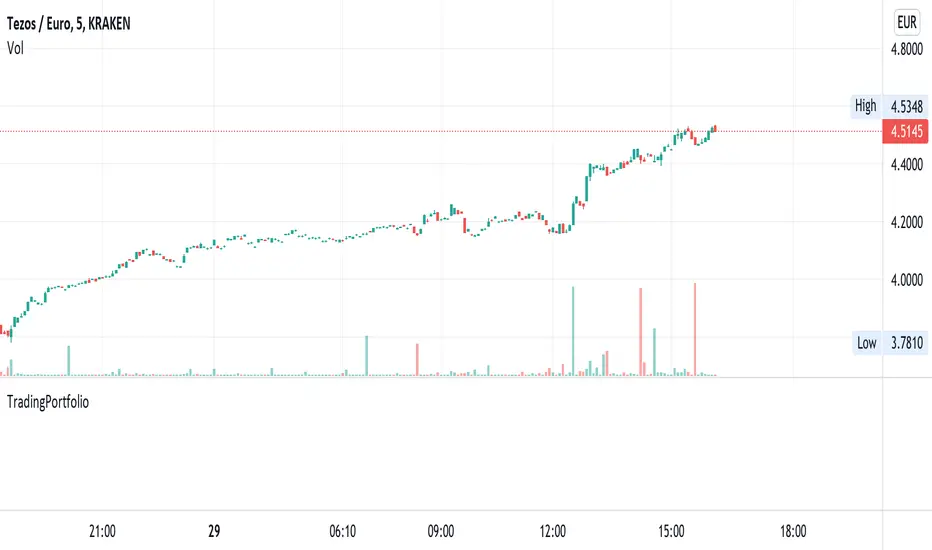
TradingPortfolioLibrary "TradingPortfolio"
Simple functions for portfolio management. A portfolio is essentially
a float array with 3 positions that gets passed around
into these functions that ensure it gets properly updated as trading ensues.
An example usage:
import hugodanielcom/TradingPortfolio/XXXX as portfolio
var float my_portfolio = portfolio.init(0.0, strategy.initial_capital) // Initialize the portfolio with the strategy capital
if close < 10.0
portfolio.buy(my_portfolio, 10.0, close) // Buy when the close is below 10.0
plot(portfolio.total(my_portfolio), title = "Total portfolio value")
get_balance(portfolio) Gets the number of tokens and fiat available in the supplied portfolio.
Parameters:
portfolio : A portfolio float array as created by the `init()` function.
Returns: The tokens and fiat in a tuple
set_balance(portfolio, new_crypto, new_fiat) Sets the portfolio number of tokens and fiat amounts. This function overrides the current values in the portfolio and sets the provided ones as the new portfolio.
Parameters:
portfolio : A portfolio float array as created by the `init()` function.
new_crypto : The new amount of tokens in the portfolio.
new_fiat : The new amount of fiat in the portfolio
Returns: The tokens and fiat in a tuple
init(crypto, fiat) This function returns a clean portfolio. Start by calling this function and pass its return value as an argument to the other functions in this library.
Parameters:
crypto : The initial amount of tokens in the portfolio (defaults to 0.0).
fiat : The initial amount of fiat in the portfolio (defaults to 0.0).
Returns: The portfolio (a float )
crypto(portfolio) Gets the number of tokens in the portfolio
Parameters:
portfolio : A portfolio float array as created by the `init()` function.
Returns: The amount of tokens in the portfolio
fiat(portfolio) Gets the fiat in the portfolio
Parameters:
portfolio : A portfolio float array as created by the `init()` function.
Returns: The amount of fiat in the portfolio
retained(portfolio) Gets the amount of reatined fiat in the portfolio. Retained fiat is not considered as part of the balance when buying/selling, but it is considered as part of the total of the portfolio.
Parameters:
portfolio : A portfolio float array as created by the `init()` function.
Returns: The amount of retained fiat in the portfolio
retain(portfolio, fiat_to_retain) Sets the amount of fiat to retain. It removes the amount from the current fiat in the portfolio and marks it as retained.
Parameters:
portfolio : A portfolio float array as created by the `init()` function.
fiat_to_retain : The amount of fiat to remove and mark as retained.
Returns: void
total(portfolio, token_value) Calculates the total fiat value of the portfolio. It multiplies the amount of tokens by the supplied value and adds to the result the current fiat and retained amount.
Parameters:
portfolio : A portfolio float array as created by the `init()` function.
token_value : The fiat value of a unit (1) of token
Returns: A float that corresponds to the total fiat value of the portfolio (retained amount included)
ratio(portfolio, token_value) Calculates the ratio of tokens / fiat. The retained amount of fiat is not considered, only the active fiat being considered for trading.
Parameters:
portfolio : A portfolio float array as created by the `init()` function.
token_value : The fiat value of a unit (1) of token
Returns: A float between 1.0 and 0.0 that corresponds to the portfolio ratio of token / fiat (i.e. 0.6 corresponds to a portfolio whose value is made by 60% tokens and 40% fiat)
can_buy(portfolio, amount, token_value) Asserts that there is enough balance to buy the requested amount of tokens.
Parameters:
portfolio : A portfolio float array as created by the `init()` function.
amount : The amount of tokens to assert that can be bought
token_value : The fiat value of a unit (1) of token
Returns: A boolean value, true if there is capacity to buy the amount of tokens provided.
can_sell(portfolio, amount) Asserts that there is enough token balance to sell the requested amount of tokens.
Parameters:
portfolio : A portfolio float array as created by the `init()` function.
amount : The amount of tokens to assert that can be sold
Returns: A boolean value, true if there is capacity to sold the amount of tokens provided.
buy(portfolio, amount, token_value) Adjusts the portfolio state to perform the equivalent of a buy operation (as in, buy the requested amount of tokens at the provided value and set the portfolio accordingly).
Parameters:
portfolio : A portfolio float array as created by the `init()` function.
amount : The amount of tokens to buy
token_value : The fiat value of a unit (1) of token
Returns: A boolean value, true the requested amount of tokens was "bought" and the portfolio updated. False if nothing was changed.
sell(portfolio, amount, token_value) Adjusts the portfolio state to perform the equivalent of a sell operation (as in, sell the requested amount of tokens at the provided value and set the portfolio accordingly).
Parameters:
portfolio : A portfolio float array as created by the `init()` function.
amount : The amount of tokens to sell
token_value : The fiat value of a unit (1) of token
Returns: A boolean value, true the requested amount of tokens was "sold" and the portfolio updated. False if nothing was changed.
Red Dog Reversal IntradayAlerts and bubbles for Red Dog Reversal (RDR) Buy/Sell on intraday chart. Optionally plots prior day High/Low/Close and alerts on price crosses of those prior levels.
Definitions:
Red Dog Reversal (RDR) sell is when the price trades below the prior day's low , then reclaims it in the same session. This is will marked with a bubble and alerted.
Red Dog Reversal (RDR) buy is when the price trades above the prior day's high , then loses it in the same session. This will be marked with a bubble and alerted.
Configuration:
Enable Alert Crossover to alert when price crosses over or under any prior day's level, i.e. High, Low, Close.
Enable Alert Reversal to alert when Red Dog Reversal Buy or Sell.
Note:
To get alerts you must create alerts on your chart, and in the configuration select RDR as the condition . Then in the Alert name select RDR: Any alert() function call

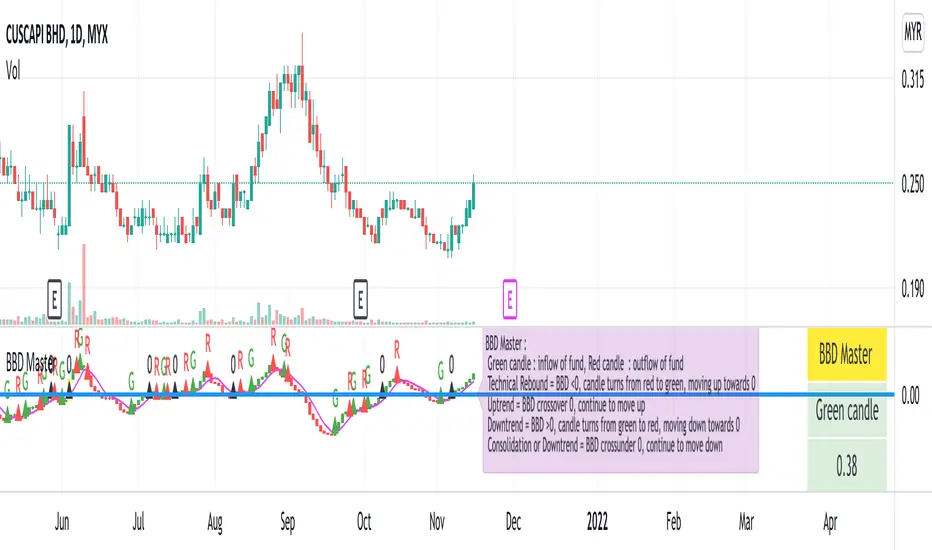
BBD MasterBBD Master :
An indicator attempts to simulate the net deviation of big buy (or inflow of fund) and big sell (or outflow of fund) of a stocks.
Regardless of BBD values, green candle means an inflow of fund resulting in net buy while red candle means an outflow of fund resulting in net sell.
It can be used for trend analysis.
When BBD is below 0 , BBD candle turns from red to green, and continue moving up towards 0, a potential sign of technical rebound.
When BBD crossover 0, and continue to move up, stocks may develop into an uptrend.
Open & Close, typically, will be above 20-day moving average.
When BBD is above 0, BBD candle turns from green to red, and continue moving down towards 0, stocks may develop into a downtrend, or at times, showing a top deviation where stocks price continue to move up while BBD moving down.
When BBD crossunder 0, and continue moving down, stocks may develop in a bearish trend or consolidation.
BBD Master, can be used together with chips master, trend master and MCDX Plus or indicators that users see fit, for better trend analysis.
Input/Comments are welcome to help improve the scripts, and may benefit users in long run. Hope this help.
Disclaimer : stocks used is meant to illustrate the indicator, no recommendation of buy/sell.
SMA Offset StrategyThis strategy uses simple moving averages and some math to determine buy/sell points. We keep a SMA 100 day line as our basis for our offset. If the close price is below the line, we choose our open position based on how low below the line it is goes, this value (Low Offset) is a percentage and can be configured by the user. Same for closing your position, when the close is above our SMA 100 line, we determine how high above the line before selling. If we try to sell too early (while the price is still rising), the trailing stop loss will kick in. Backtested with Bitcoin and Ethereum.
Configurable variables:
SMA Fast (default is 14 days)
SMA Slow (default is 100)
SMA Reference (default is 30)
Low Offset % (default is 0.001)
High Offset % (default is 0.0164)
Order Stake % (default is 0.96)
Trailing stop loss % (default is 1.35)

[VJ] Mega Supertrend for IntradayThis is a simple intraday strategy for working on Stocks or commodities based out on Super Trend and intraday's best friend - VWAP . You can modify the start time and end time based on your timezones. Session value should be from market start to the time you want to square-off
Important: The end time should be at least 2 minutes before the intraday square-off time set by your broker
Comment below if you get good returns
Strategy: Tweaked Super trend with VWAP
Indicators used :
Super trend is simple and easy to use indicator and gives a precise reading about an on going trend.It is built with two parameters, namely period and multiplier.The Buy and Sell signal modifies once the indicator tosses over the closing price. When the Super trend closes above the Price, a Buy signal is generated, and when the Super trend closes below the Price, a Sell signal is generated. In this case we use it only for direction .
Multiplier is a vital input for Super trend. If the multiplier value is too high, then lesser number of signals is made.
Volume is important as we don’t want to get stuck with a stock which has few takers, even if you think it is priced attractively. Thus, the VWAP was created to take into account both volume as well as Price so that the potential trader would make the trading decision or not.
In simple terms, the Volume Weighted Average price is the cumulative average price with respect to the volume
Buying/Selling
when the closing price starts moving up/down and farther from the VWAP, there is pressure among the traders to sell/buy, a general belief kicks in that it might be that the stock is overvalued/undervalued .This is the time when we couple the Super trend to take our entries
Usage & Best setting :
Choose a good volatile stock and a time frame - 5m.
ST multiplier : 3
There is stop loss and take profit that can be used to optimise your trade
The template also includes daily square off based on your time.

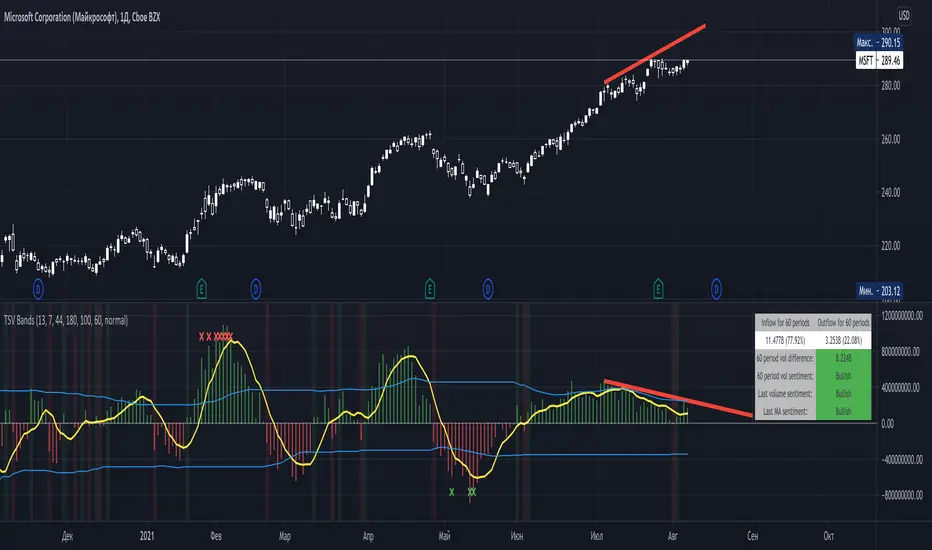
Time Segmented Volume BandsTime Segmented Volume Bands
This time I took as a basis TSV - Time Segmented Volume, a rather rare one, almost never mentioned on TradingView.
TSV is a leading indicator because its movement is based on both the movement of the stock price and its volume. Ideal entry and exit points are usually found when a stock moves through a baseline. This indicator is similar to the more well-known balance volume (OBV) because it measures the amount of money flowing in or out of a particular stock.
What is their main difference between TSV and OBV?
Time Segmented Volume is used to eliminate distortions of the standard volume graph. OBV is based on cumulative total volume, while TSV compares the current time period with the previous one, without a subtotal.
What I added on my own script
Bands, similar to Bollinger. The main idea is to have an idea of the average inflow and outflow of volumes from / to shares for a particular period. We have an opportunity to estimate how much the current volumes differ from the average for 60 days (all values can be flexibly adjusted).
Excess markers by the current average volume (sensitivity can be adjusted separately).
A table that calculates the total sentiment (force) of volume on average for N periods in comparison with the current one.
Sell/buy markers
How to read a TSV graph
The main graph is a histogram. Green bars mean an inflow of volume, red bars mean an outflow. When the red volume crosses the baseline zero, it is considered a buy signal (in the classic TSV version). A similar sell signal - just the opposite. I highlight them with a colored background fill.
It is especially important to find divergences on the chart. For example, when the volume peaks getting lower but the price rises (short).
The yellow line is the average TSV for 7 periods. Just a smoother lagging line.
Blue stripes. Above - the average inflow of volumes over N periods (44 days). Below - the average outflow.
Markers are additional buy / sell signals generated when the current TSV value exceeds the average for N periods. In the script settings, you can choose how many percent deviations from the average should occur in order to count it as a strong signal (by default, an excess of 180% for selling, 100% for buying). The main idea of the marker is to catch a better price than with the standard TSV logic (take at the intersection of the zero line). The marker can serve as both an assistant and drive into a trap. If you are not very confident, then it is better to adhere to standard practice, and set the excess of markers to completely abnormal situations, so that it triggers less often.
Colored background - a classic buy or sell zone (when crossing the TSV baseline).
Table - you can configure its presence and size in the settings. On it you can estimate the sentiment of the movement of money for the last N periods. Pay particular attention to the % value in parentheses. It shows the strength of the trend in volumes over N periods.
The basic rule, as with any trend indicator: do not trade against the trend. A sell signal in a constantly rising channel is not a short signal. This is a signal for a possible fixation of a part of the position. No more.
How do I use this indicator?
For starters, I never make decisions purely based on an indicator. TSV plays the role of a clearer visualization of volumes for me. If I see that the volumes are fading away (thin market), then I try not to enter the trade. For the last two weeks, while picking charts, I completely abandoned standard volume bars in favor of TSV due to it's greater informative.

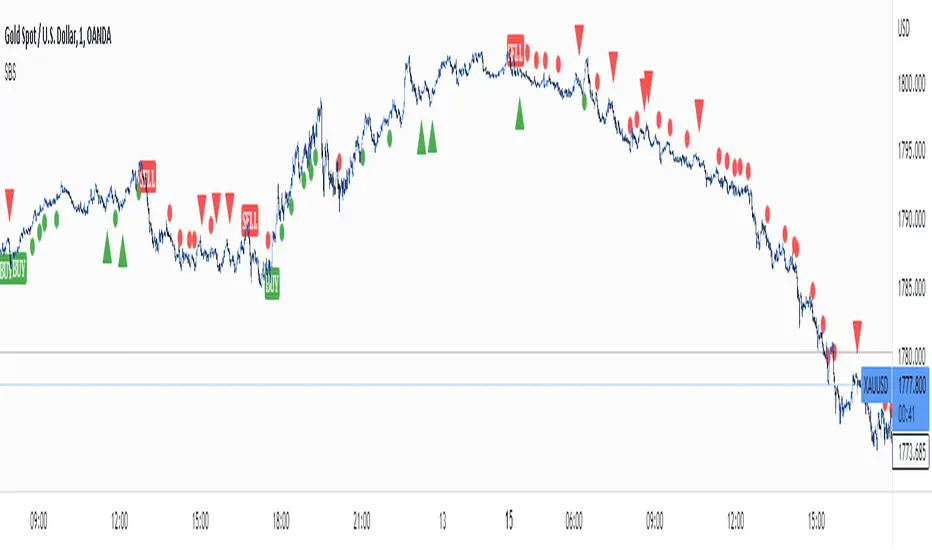
No-lose trading targets (based on RSI) By Mustafa ÖZVERThis code shows expected reaction target prices after sudden moving based on RSI. Red area means the price is on overbought area, green area means the price is on oversold area. If you see red area under price, you can make short option to next to the horizontal beginning price of red area. If you see green area over price, you can make long option to next to the horizontal beginning price of green area.
When this code works
- The green area starts where rsi value is on oversold
- The red area starts where rsi value is on overbought
Of course, this code may be failed, do not forget the target may never come. But hopefully price will cross over the target.
And you (as developers) can develop this code by using anything instead of rsi to get up-down target prices.
But only this values can not guarantee good results for trading. BE CAREFUL

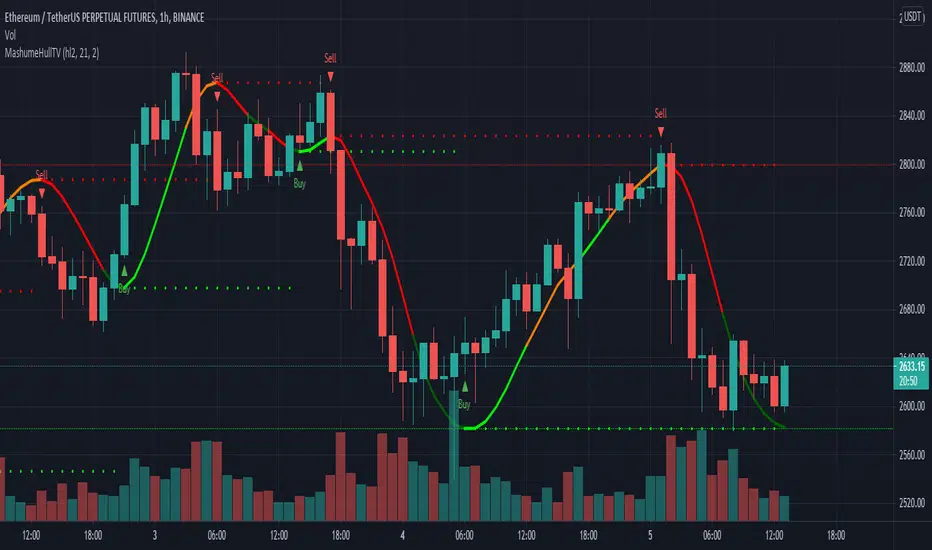
MashumeHullTV█ OVERVIEW
This plots the Hull Moving Average Turning Points and Concavity
with the addition of colored segments representing concavity and turning points: maxima, minima and inflection.
a fast way to determine the trend direction and possible reversals based on concavity of the trend
Dark Green: Concave Up but HMA decreasing. The 'mood' has changed and the declining trend of the HMA is slowing. Possible trend change to Uptrend soon
Light Green: Concave up and HMA increasing. Price is increasing, and since the curve is still concave up, it is accelerating upward. Uptrend
Orange: Concavity is now downward, and though price is still increasing, the rate has slowed, perhaps the mood has become less enthusiastic. Possible trend change to Downtrend soon
Red: Concave down and HMA decreasing. Downtrend
Buy signals generated when Hull turns from Dark Green -> Light Green
Sell signals generated when Hull turns from Orange -> Red
To best determine if this is a entry point or a trend reversal, it is recommended to use in conjunction with the QQEMoMoTV indicator
█ FEATURES
Calculations
Calculates the concavity of the Hull Moving Average comparing the Hull concavity of the current bar to the previous bar and displays the concavity in the form of 4 different colors.
Note: may cause repainting, so recommended to use with another indicator such as the QQEMoMoTV indicator to confirm signals.
Calculates divergence between the calculated HMA and the actual price and displays this in the Divergence Label.
Calculates the local minima, maxima and inflection points with the ability to display these as auto support/resistance lines.
Inputs
You can use the script's inputs to configure:
• Calculation Source (default HL2)
• HMA Length (default 21)
• Lookback (default 2)
• Whether to show Auto Support/Resist Lines
• Whether to show Buy/Sell Arrows
• Whether to show Divergence Label
• Whether to extend Local Auto Support/Resist Lines
Alerts
Buy Signal alert based on HMA crossing above MA_Min/Hull Support, when Hull turns from Dark Green -> Light Green, Bullish
Sell Signal alert based on HMA crossing below MA_Max/Hull Resistance, when Hull turns from Orange -> Red, Bearish
Experimental support for applying the indicator to higher time frames
eg. charting the hourly MashumeHull indicator on 15 min chart. See the commented code to access this feature
█ CREDITS
Original Author: Seth Urion (Mashume)
Feature upgrades and usage: Xiuying
Converted to Tradingview by: Machdragon
Best Bulls Bears Volume trend Breakout V2 [badshah_e_alam]This is a intraday indicator. Only to be used on timeframe less than daily charts.
This indicator purely uses volume to plot the graph. The indicator helps in conforming a breakout strategy.
This indicator is advanced version of my previously developed indicator you can check this link
Total volume is made up of buying volume and selling volume . Buying volume is the number of shares, contracts, or lots that were associated with green bars, and selling volume is the number that were associated with red bars.
The labels on the right side are the current bar value and that days bulls /bears weightage.
the first value shows the current bar volume.
second value show the bulls weight in %
third value show the bears weightage throughout the day ( %)
The Blue plot in graph keeps the track of bulls movement in intraday( %)
The Red plot in graph keeps the track of bears movement in intraday ( %)
X axis is time.
Y axis ranges from 100 to -100
I use 1:2 risk to reward ratio. Do your own research.
**not a financial advice**
Example of price increasing, volume decreasing
this indicator can be used for confirming a breakout strategy with bulls or bears in action. In the current example, the buyer’s volume percentage is reducing and the price is increasing throughout the day. Hence a breakout of the trendline is confirmation of a short trade.
Example of Price reducing, volume decreasing
example of price moving down , bears losing the grip
Example of price decreasing volume increasing
Thanks to nizar9599 for giving idea to improve my previous indicator.
DISCLAIMER
Any and all liability for risks resulting from investment transactions or other asset dispositions carried out by the user based on information received or a market analysis is expressly excluded by me.
All the information made available here is generally provided to serve as an example only, without obligation and without specific recommendations for action. It does not constitute and cannot replace investment advice. We therefore recommend that you contact your personal financial advisor before carrying out specific transactions and investments.
Do your own research, This is not a financial advice.

72s Strat: Backtesting Adaptive HMA+ pt.1This is a follow up to my previous publication of Adaptive HMA+ few months ago, as a mean to provide some kind of initial backtesting tools. Which can be use to explore many possible strategies, optimise its settings to better conform user's pair/tf, and hopefully able to help tweaking your general strategy.
If you haven't read the study or use the indicator, kindly go here first to get the overall idea.
The first strategy introduce in this backtest is one most basic already described in the study; buy/sell is when movement is there and everything is on the right side; When RSI has turned to other side, we can use it as exit point (if in profit of course, else just let it hit our TP/SL, why would we exit before profit). Also, base on RSI when we make entry, we can further differentiate type of signals. --Please check all comments in code directly where the signals , entries , and exits section are.
Second additional strategy to check; is when we also use second faster Adaptive HMA+ for exit. So this is like a double orders on a signal but with different exit-rule (/more on this on snapshots below). Alternatively, you can also work the code so to only use this type of exit.
There's also an additional feature which you can enable its visuals, the Distance Zone , is to help measuring price distance to our xHMA+. It's just a simple atr based envelope really, I already put the sample code in study's comment section, but better gonna update it there directly for non-coder too, after this.
In this sample I use Lot for order quantity size just because that's what I use on my broker. Also what few friends use while we forward-testing it since the study is published, so we also checked/compared each profit/loss report by real number. To use default or other unit of measurement, change the entry code accordingly.
If you change your order size, you should also change the commission in Properties Tab. My broker commission is 5 USD per order/lot, so in there with example order size 0.1 lot I put commission 0.5$ per order (I'll put 2.5$ for 0.5 lot, 10$ for 2 lot, and so on). Crypto usually has higher charge. --It is important that you should fill it base on your broker.
SETTINGS
I'm trying to keep it short. Please explore it further again. (Beginner should also first get acquaintance with terms use here.)
ORDERS:
Base Minimum Profit Before Exit:
The number is multiplier of ongoing ATR. Means that when basic exit condition is met, algo will check whether you're already in minimum profit or not, if not, let it still run to TP or SL, or until it meets subsequent exit condition, then it will check again.
Default Target Profit:
Multiplier of ATR at signal. If reached before any eligible exit condition is met, exit TP.
Base StopLoss Point:
You can change directly in code to use other like ATR Trailing SL, fix percent SL, or whatever. In the sample, 4 options provided.
Maximum StopLoss:
This is like a safety-net, that if at some point your chosen SL point from input above happens to be exceeding this maximum input that you can tolerate, then this max point is the one will be use as SL.
Activate 2nd order...:
The additional doubling of certain buy/sell with different exits as described above. If enable, you should also set pyramiding to at least: 2. If not, it does nothing.
ADAPTIVE HMA+ PERIOD
Many users already have their own settings for these. So in here I only sample the default as first presented in the study. Make it to your adaptive.
MARKET MOVEMENT
(1) Now you can check in realtime how much slope degree is best to define your specific pair/tf is out of congestion (yellow) area. And (2) also able to check directly what ATR lengths are more suitable defining your pair's volatility.
DISTANCE ZONE
Distance Multiplier. Each pair/tf has its own best distance zone (in xHMA+ perspective). The zone also determine whether a signal should appear or not. (Or what type of signal, if you wanna go more detail in constructing your strategy)
USAGE
(Provided you already have your own comfortable settings for minimum-maximum period of Adaptive HMA+. Best if you already have backtested it manually too and/or apply as an add-on to your working strategy)
1. In our experiences, first most important to define is both elements in the Market Movement Settings . These also tend to be persistent for whole season since it's kinda describing that pair/tf overall behaviour. Don't worry if you still get a low Profit Factor here, but by tweaking you should start to see positive changes in one of Max Drawdown and Net Profit, or Percent Profitable.
2. Afterwards, find your pair/tf Distance Zone . When optimising this, what we seek is just a "not to bad" equity curves to start forming. At least Max Drawdown should lessen more. Doesn't have to be great already, but should be better, no red in Net Profit.
3. Then go manage the "Trailing Minimum Profit", TP, SL, and max SL.
4. Repeat 1,2,3. 👻
5. Manage order size, commission, and/or enable double-order (need pyramiding) if you like. Check if your equity can handle max drawdown before margin call.
6. After getting an acceptable backtest result, go to List of Trades tab and find the biggest loss or when many sequencing loss in a row happened. Click on it to go to exact point on chart, observe why the signal failed and get at least general idea how it can be prevented . The rest is yours, you should know your pair/tf more than other.
You can also re-explore your minimum-maximum period for both Major and minor xHMA+.
Keep in mind that all numbers in Setting are conceptually in a form of range . You don't want to get superb equity curves but actually a "fragile" , means one can easily turn it to disaster just by changing only a fraction in one/two of the setting.
---
If you just wanna test the strength of the indicator alone, you can disable "Use StopLoss" temporarily while optimising settings.
Using no SL might be tempting in overall result data in some cases, but NOTE: It is not recommended to not using SL, don't forget that we deliberately enter when it's in high volatility. If want to add flexibility or trading for long-term, just maximise your SL. ie.: chose SL Point>ATR only and set it maximum. (Check your max drawdown after this).
I think this is quite important specially for beginners, so here's an example; Hypothetically in below scenario, because of some settings, the buy order after the loss sell signal didn't appear. Let's say if our initial capital only 1000$ using leverage and order size 0,5 lot (risky position sizing already), moreover if this happens at the beginning of your trading season, that's half of account gone already in one trade . Your max SL should've made you exit after that pumping bar.
The Trailing Minimum Profit is actually look like this. Search in the code if you want to plot it. I just don't like too many lines on chart.
To maximise profit we can try enabling double-order. The only added rule coded is: RSI should rising when buy and falling when sell. 2nd signal will appears above or below default buy/sell signal. (Of course it's also prone to double-loss, re-check your max drawdown after. Profit factor play its part in here for a long run). Snapshot in comparison:
Two default sell signals on left closed at RSI exit, the additional sell signal closed later on when price crossover minor xHMA+. On buy side, price haven't met our minimum profit when first crossunder minor xHMA+. If later on we hit SL on this "+buy" signal, at least we already profited from default buy signal. You can also consider/treat this as multiple TP points.
For longer-term trading, what you need to maximise is the Minimum Profit , so it won't exit whenever an exit condition happened, it can happen several times before reaching minimum profit. Hopefully this snapshot can explain:
Notice in comparison default sell and buy signal now close in average after 3 days. What's best is when we also have confirmation from higher TF. It's like targeting higher TF by entering from smaller TF.
As also mention in the study, we can still experiment via original HMA by putting same value for minimum-maximum period setting. This is experimental EU 1H with Major xHMA+: 144-144, Flat market 13, Distance multiplier 3.6, with 2nd order activated.
Kiwi was a bit surprising for me. It's flat market is effectively below 6, with quite far distance zone of 3.5. Probably because I'm using big numbers in adaptive period.
---
The result you see in strategy tester report below for EURUSD 15m is using just default settings you see in code, as follow:
0,1 lot for each order (which is the smallest allowed by my broker).
No pyramiding. Commission: 0.5 usd per order. Slippage: 3
Opening position is only using basic strategy #1 (RSI exit). Additional exit not activated.
Minimum Profit: 1. TP: 3.
SL use: Half-distance zone. Max SL: 4.5.
Major xHMA+: 172-233. minor xHMA+: 89-121
Distance Zone Multiplier: 2.7
RSI: Standard 14.
(From our forward-testing, the difference we get from net profit is because of the spread, our entry isn't exactly at the close/open price. Not so much though, but not the same. If somebody can direct me to any example where we can code our entry via current bid/ask price, that would be awesome!)
It's already a long post (sorry), think I'm gonna pause here. Check out the code :)
---
DISCLAIMER: Past performance is no guarantee of future results , and so on.. you know the drill ;)
Please read whole description first before using, don't take 1-2 paragraph and claim it's the whole logic, you are responsible of your own actions and understanding.
